

agno_traces and agno_spans in the same db you already use for sessions and memory.
Your data never leaves your db
This is the difference between AgentOS tracing and hosted observability platforms.
Prompts, tool arguments, and model outputs often contain customer PII, internal data, and proprietary logic. With AgentOS tracing, none of it crosses your network boundary. You own the data, you control retention, and you can query it with the database tools you already run.
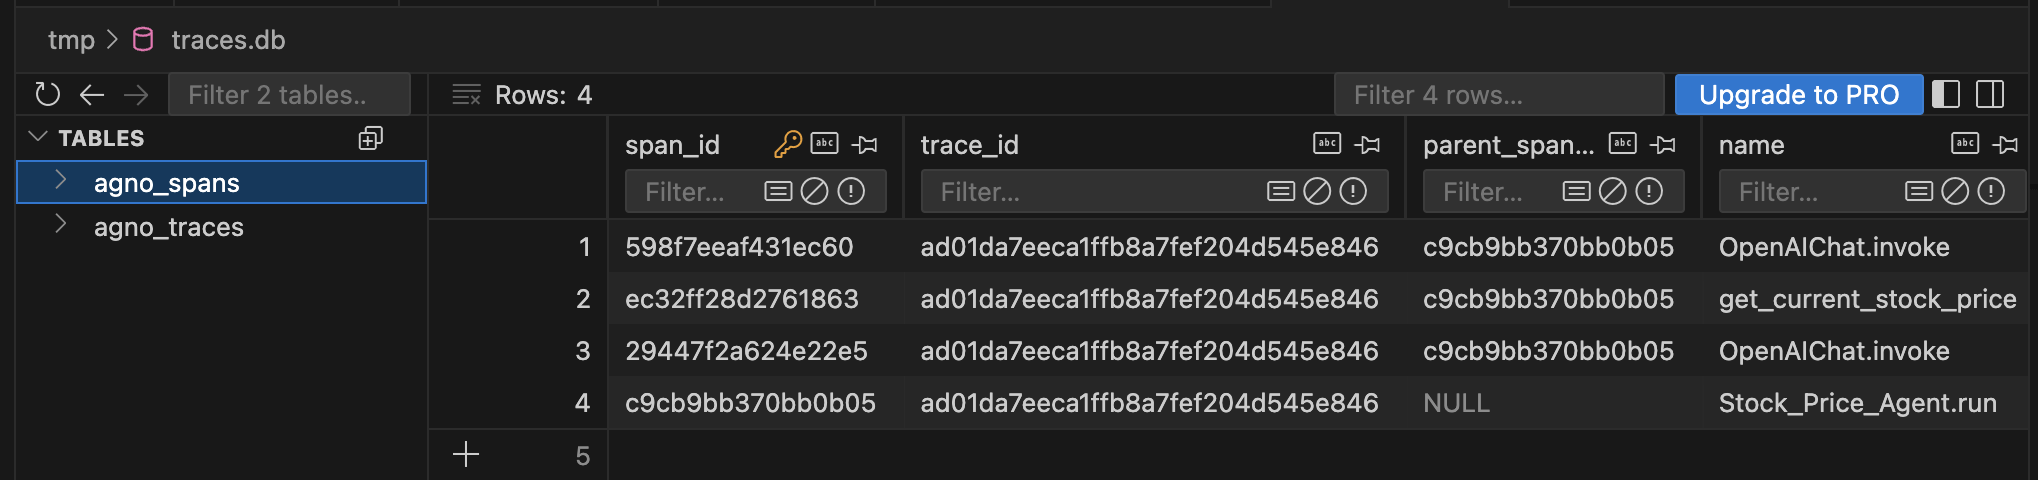
Traces stored in your own database, viewed in a SQL client
What gets captured
Traces follow OpenInference semantic conventions, so you can query them directly:
In the AgentOS UI
The control plane renders the same traces visually. Click a run to see the full tree: LLM hops, tool calls with their inputs and outputs, and sub-agent traces. Filter by user, session, or time range.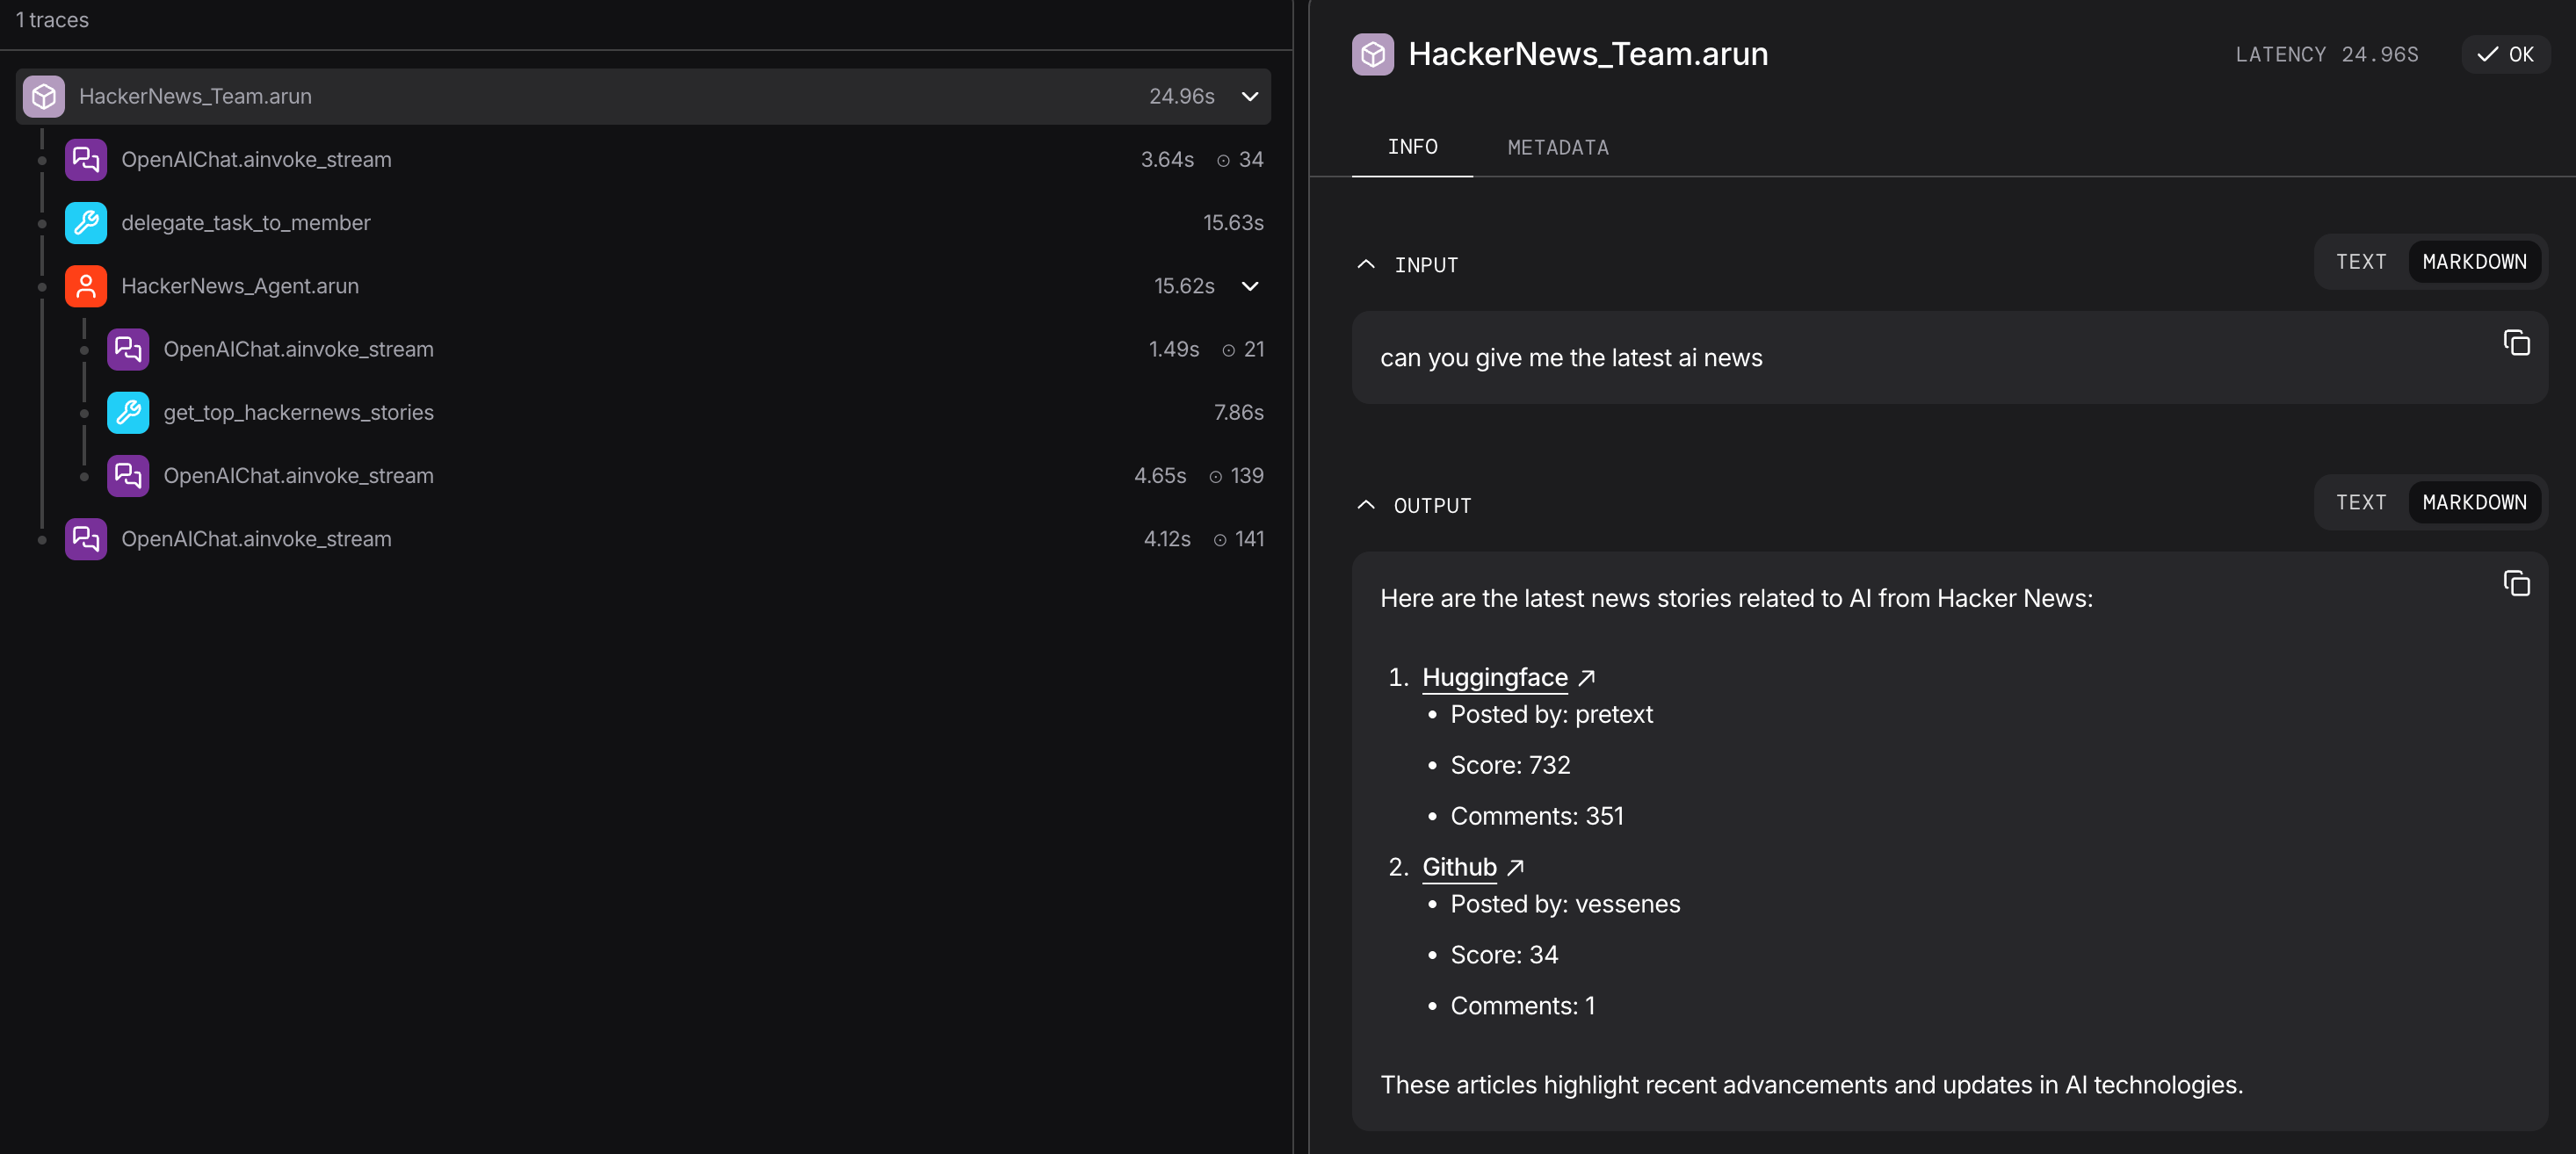
The same traces, rendered in the AgentOS control plane
Multi-database tracing
Traces are high-volume and write-heavy, with a different cost profile, retention, and access pattern than sessions. For production, route them to a dedicated database by pointing the AgentOSdb at it:
db is where traces land. Keeping it separate isolates trace write volume from your agent data and gives you independent retention and scaling.
See Multi-DB tracing for the setup_tracing() variant with batch tuning.